Alerting
This guide walks through the creation of alerts, which are used to notify your team of downtime and performance issues.
Creating an alert
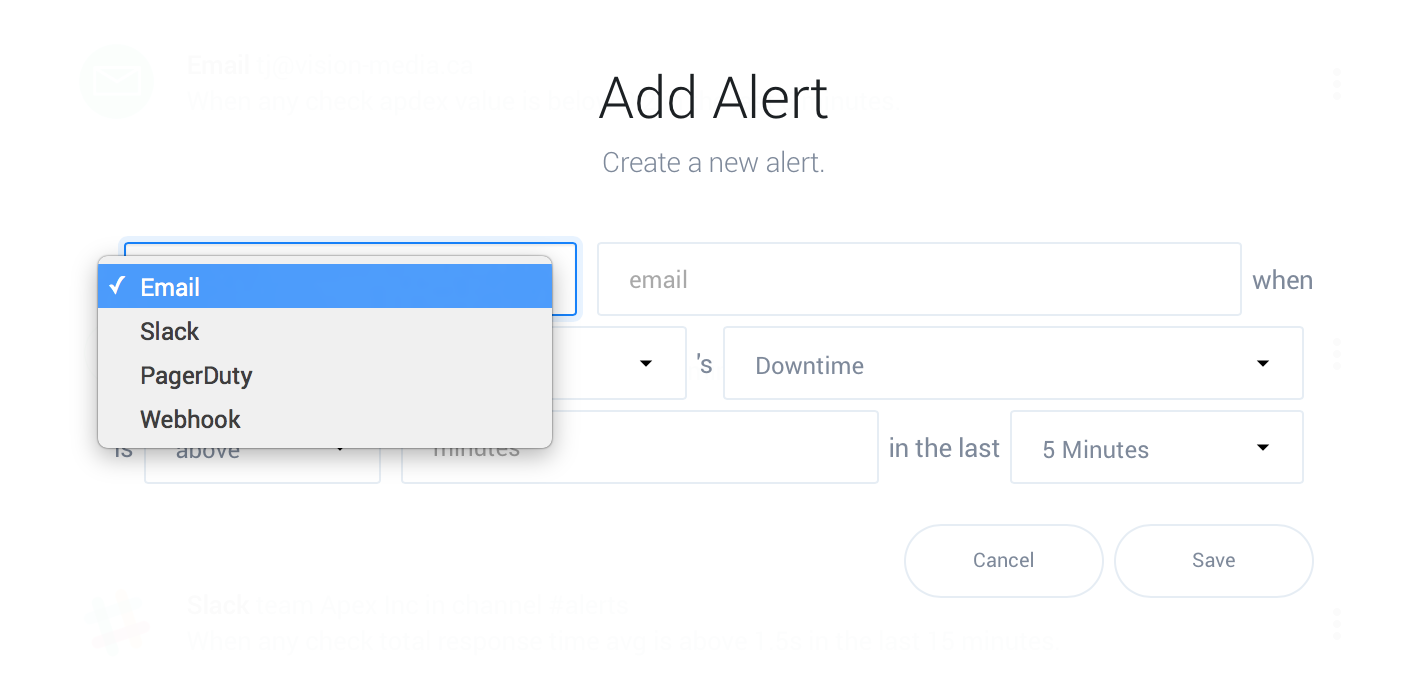
Click the plus symbol on the page to view the alert creation form. Select the type of action to perform from Slack, PagerDuty, webhook request, or email as shown here:
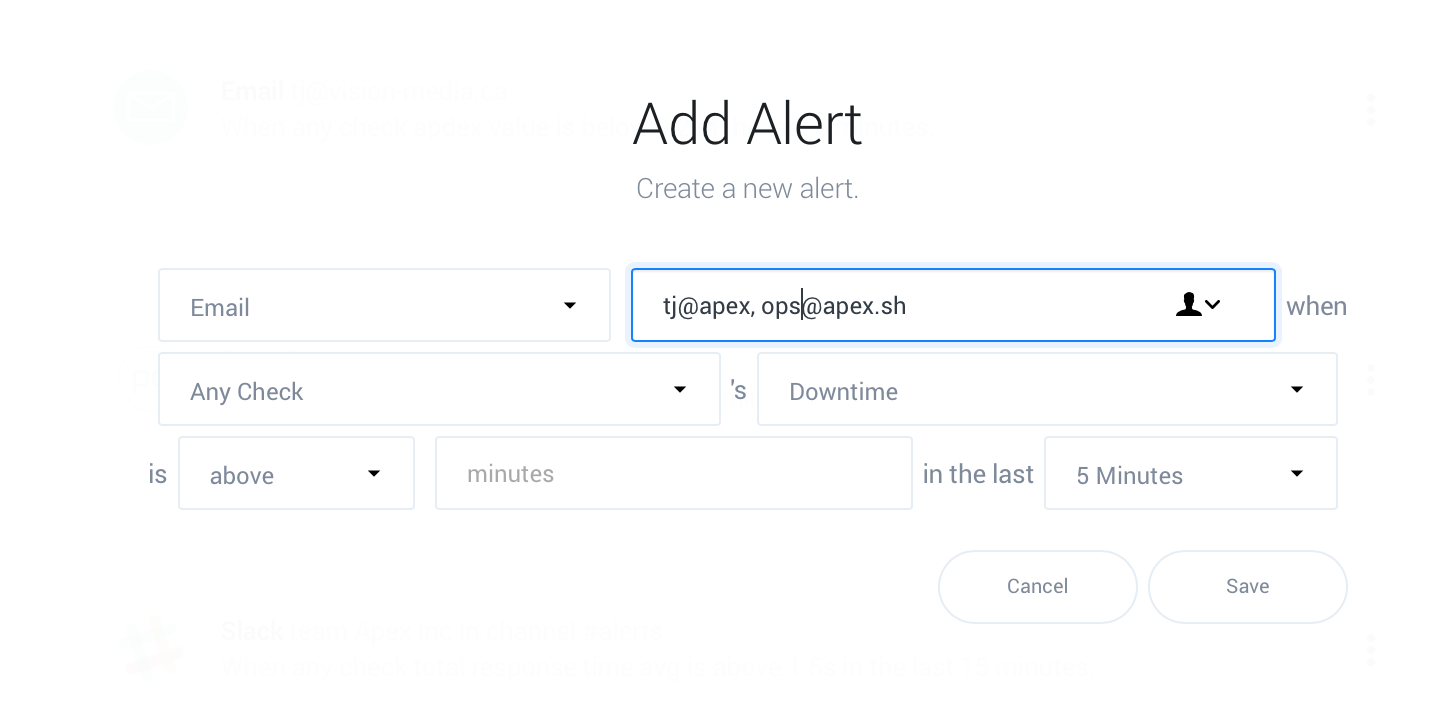
Slack and PagerDuty integrations will redirect you to the corresponding site to integrate, while webhooks require a value, in this example the email(s) you’d like to notify:
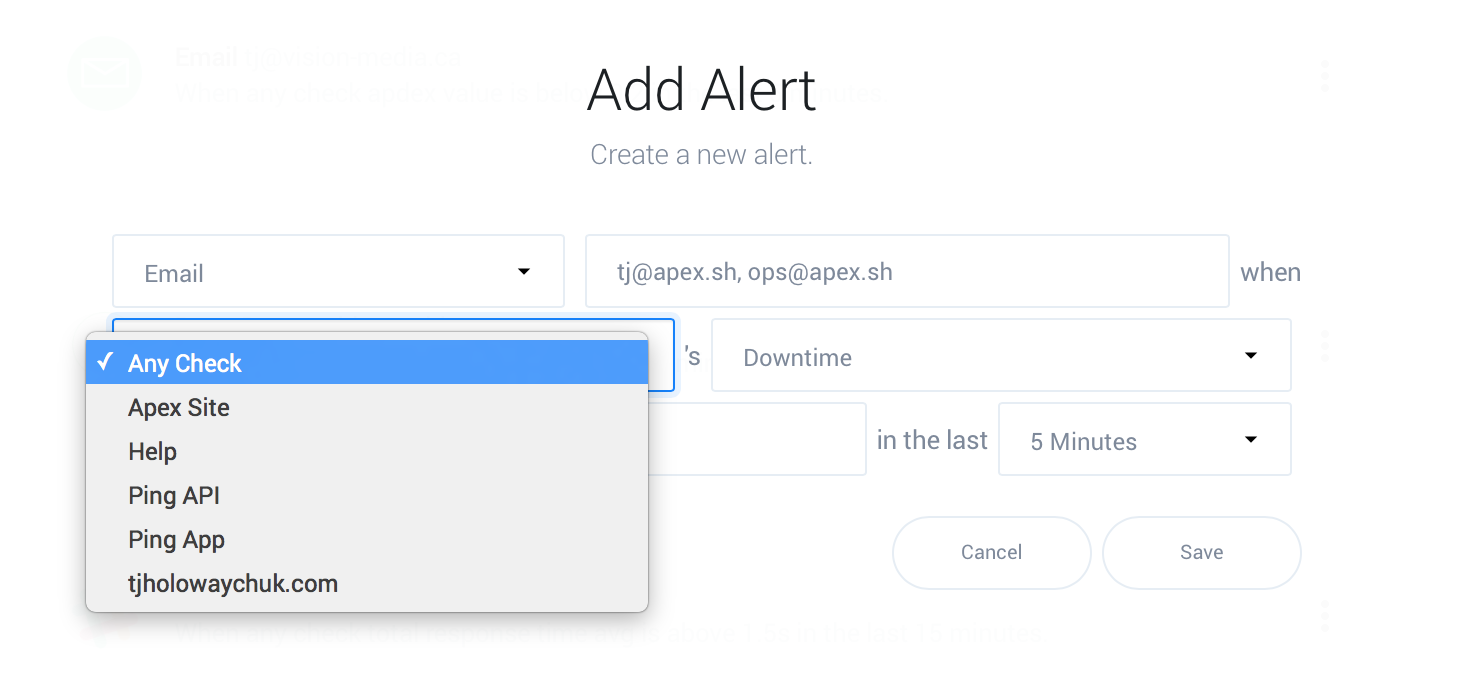
Choose if the alert applies to every check, or a single check.
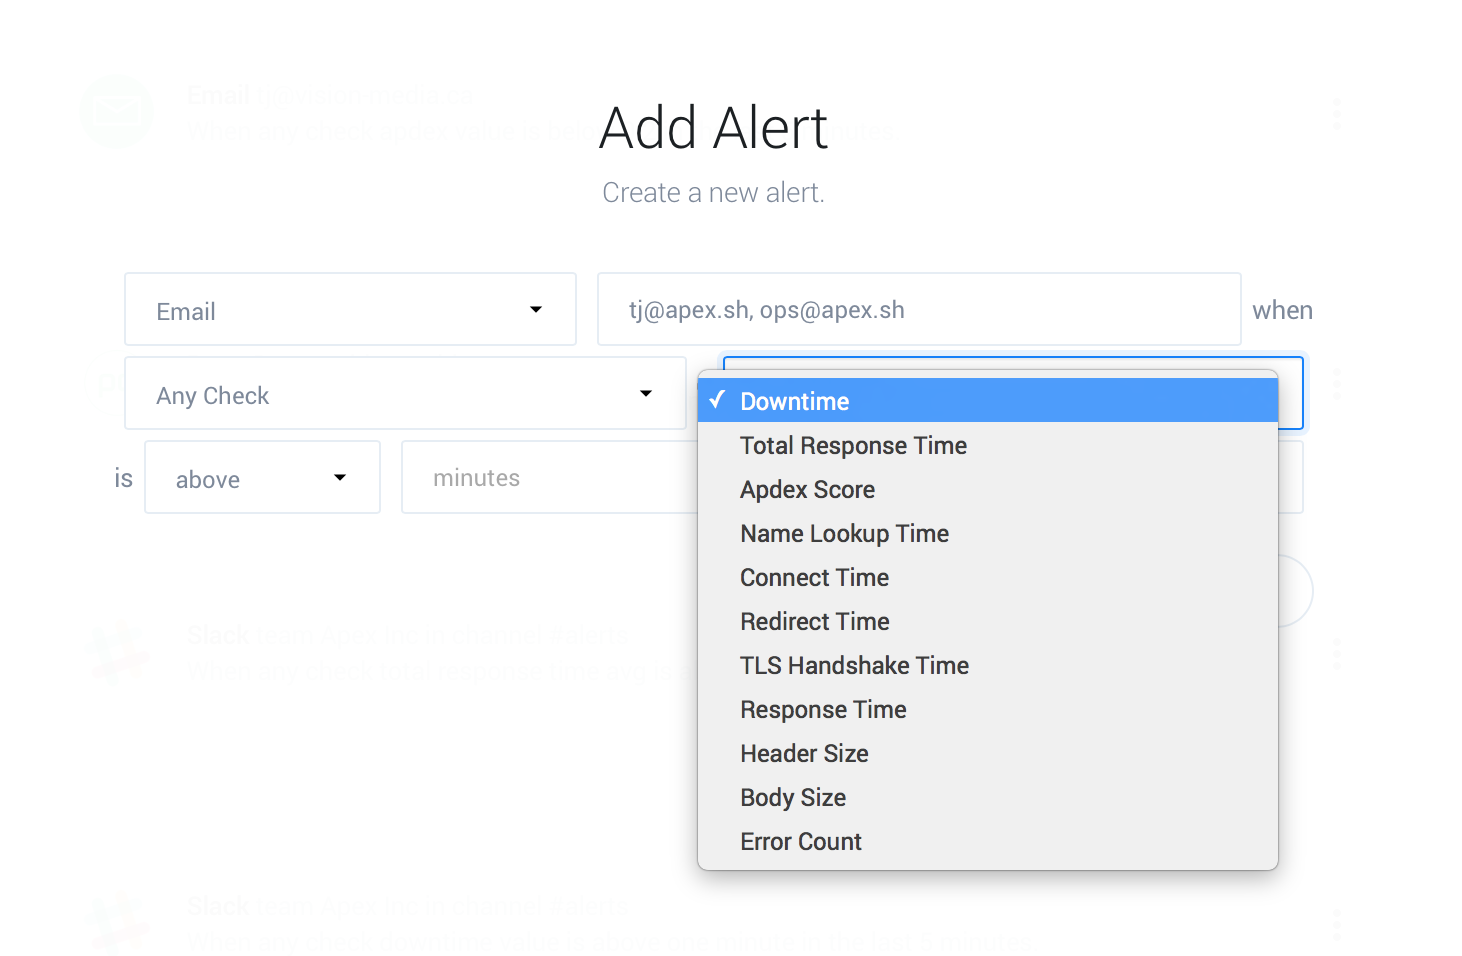
Select a metric to alert on, if your only concern is that the website, API, or application is up then select “Downtime”. You may wish to report on unresponsive endpoints using “Total Response Time” as well.
Enter the number of minutes of downtime within the time window (15 Minutes here) which is acceptable before triggering an alert. Choosing this value depends greatly on the nature of your service.
For less obtrusive actions such as Slack or email it may be fine to trigger an alert when downtime is above a minute or two, however triggering a PagerDuty for an intermittent problem is less desirable.
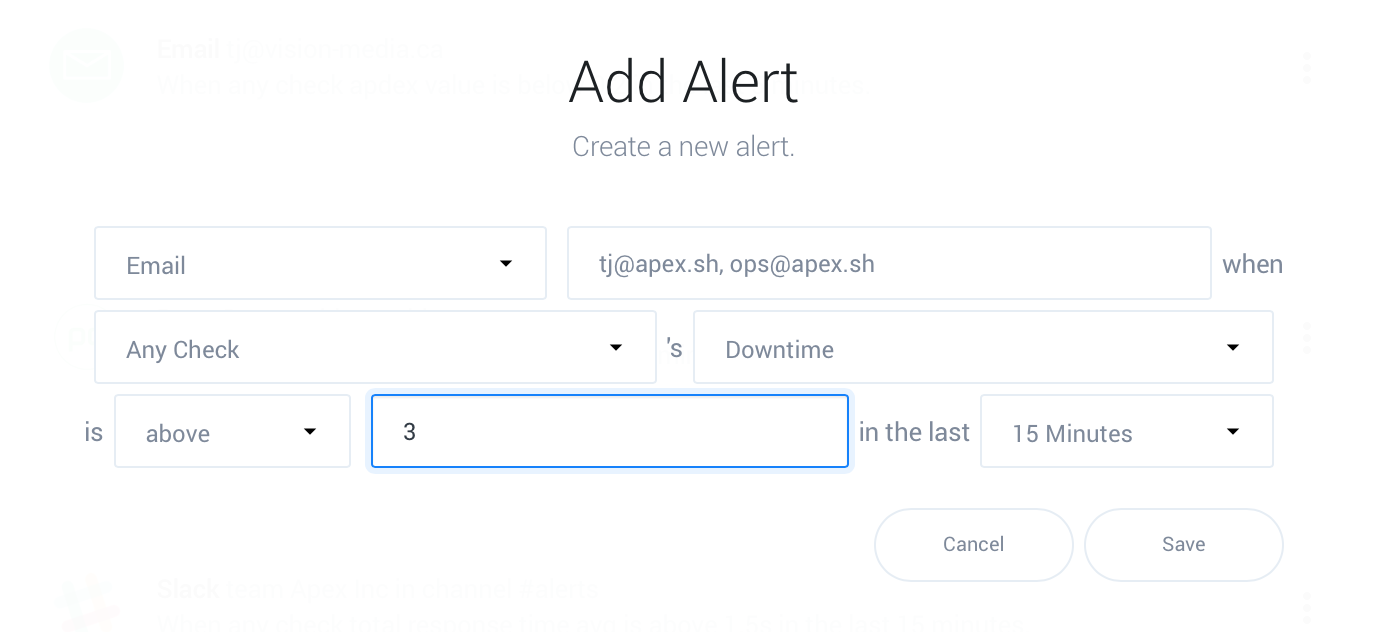
Click save and you're good to go!
Types of alerts
Apex Ping supports a variety of metrics to alert on. You’ll likely want a “Downtime” and “Total Response Time” alert to ensure availability and responsiveness. Some alerts such as “Total Response Time” allow you to alert against stats such as min, max, average or percentiles for additional control.
- Total Response Time: Time taken to complete the entire request
- Downtime: Approximate downtime in minutes
- Apdex Score: Average Apdex score
- Name Lookup Time: Time taken to perform DNS lookup
- Connect Time: Time taken to establish TCP connection
- Redirect Time: Time taken to perform redirect(s)
- TLS Handshake Time: Time taken to negotiate the secure connection handshake
- Response Time: Time taken for the server to respond, excluding connection latency
- Header Size: Response header size in bytes
- Body Size: Response body size in bytes
Reducing noise from alerts
If you’re receiving too many notifications, you may want to consider increasing the threshold and alert window — let’s look at a few examples.
The most sensitive alert possible would be: Downtime is
above 0 minutes in the past 5 minutes, notifying you as
soon as a single error is detected, remaining triggered until 5
minutes of uptime is seen by the alerting system, after which it
may trigger again.
To decrease the sensitivity you could try Downtime is above
3 in the past 5 minutes, triggering after 3 uptime
confirmations have failed.
Alternatively, the alert window may be increased to lower the
frequency of resolving, for example, the configuration
Downtime is above 0 minutes in the past 60 minutes
will trigger immediately, resolving after observing 60 minutes of
uptime, resulting in fewer notifications.
How downtime confirmation works
Apex Ping currently confirms downtime in three additional locations to ensure that the failure is not intermittent. This helps reduce false-positives, however it’s important to note that a single “minute” of downtime is effectively equivalent to four HTTP requests failing.
Requests which take longer than 10 seconds time out, and are treated as errors which contribute to downtime.
Alert email delivery
Alert emails are delivered from the alerts@apex.sh address, subjects are formatted as follows, which may be useful for integration with services such as OpsGenie:
- [triggered] tjholowaychuk.com: Downtime is above one minute.
- [resolved] tjholowaychuk.com: Downtime is no longer above one minute.